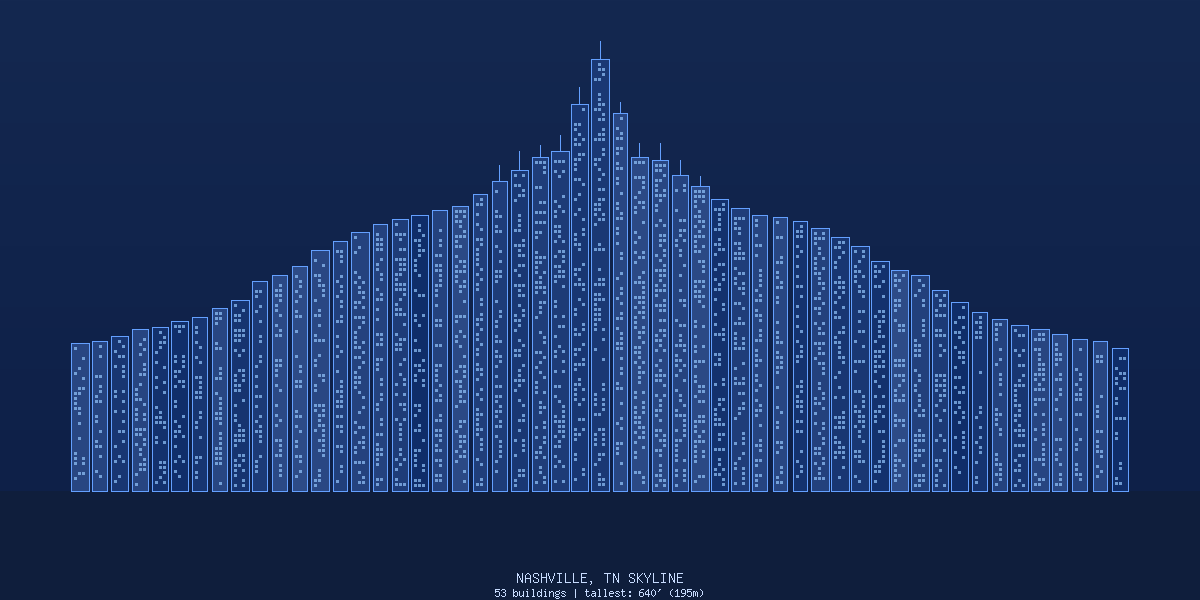
Nashville: Multi-faceted Hub
AI is rapidly automating routine knowledge work like report writing, compressing job hierarchies and shifting value away from production toward judgment. As machines generate fluent output, human expertise increasingly lies in framing the right questions, evaluating results, and taking responsibility for decisions rather than drafting text.
# Nashville's Economic Renaissance: A Comprehensive Analysis of Music, Tech, Healthcare, and Generational Dynamics vs. Austin ## Executive Summary Nashville has evolved from a regional music hub into a diversified economic powerhouse, challenging traditional Sunbelt rivals like Austin through strategic industry development and demographic advantages. With employment growth of 2% year-to-date (nearly double the national average) and unemployment at 2.9% compared to the national 4.4%, Nashville demonstrates superior economic momentum relative to Austin's 3.5% unemployment rate. This analysis examines Nashville's transformation across five critical sectors: music and film production, technology and AI, healthcare, higher education, and demographic dynamics, comparing performance metrics with Austin to understand competitive positioning and growth trajectories. **Key Findings:** - Nashville's economy contributes $7.5 billion from tech sector alone, with healthcare representing over $97 billion in global annual revenue - 120,000+ students across 20+ universities create sustained talent pipeline - Superior population growth sustainability compared to Austin's recent slowdown - Music industry maintains economic significance while tech and healthcare drive diversification --- ## 1. Economic Landscape and Growth Dynamics ### Nashville's Economic Foundation Nashville's diverse industry base spans healthcare, education, technology, and logistics, driving steady job creation through strategic location advantages as a central commerce hub. The metropolitan statistical area encompasses 14 counties with current population of approximately 1,333,000 as of 2024, reflecting 1.37% annual growth. **Table 1: Nashville vs. Austin Economic Indicators (2024-2025)** | Metric | Nashville MSA | Austin MSA | National Average | | ------------------------ | ------------- | ------------------- | ---------------- | | Unemployment Rate | 2.9% | 3.5% | 4.4% | | Employment Growth (YoY) | 2.0% | 0.48% | 1.4% | | Population Growth | 1.37% | 0.4% | ~0.9% | | Median Home Price | $490,000 | $350,600 | $407,500 | | Average Household Income | $112,434 | $130,163 | ~$70,000 | | | Job Openings Surplus | 47,000+ | N/A | N/A | ### Geographic and Spatial Considerations Nashville's central location within the Eastern Time Zone provides logistical advantages for commerce, particularly relevant for cartographic analysis of economic flows. The Nashville International Airport serves 19 airlines with 523 daily arrivals/departures to 98 nonstop destinations, creating superior connectivity compared to Austin's more peripheral location in Central Texas. Tennessee's inflation-adjusted GDP is projected at 2.4% growth in 2024 and 2.5% in 2025, while U.S. economy expected only 2% growth in 2025, indicating state-level advantages supporting Nashville's metropolitan performance. --- ## 2. Music and Film Production: Cultural Economy Evolution ### Music Industry Infrastructure and Impact Nashville's music economy demonstrates remarkable resilience and expansion beyond traditional country music boundaries. The city hosts 180+ recording studios and major labels including Sony and Universal, while maintaining over 120 music venues and the iconic Honky Tonk Highway. **Comparative Music Economy Analysis:** Texas's statewide music industry generated $4.9 billion in yearly earnings and $12.5 billion in economic activity during 2024, creating 86,000 permanent careers. However, this represents the entire state's output, while Nashville's music concentration creates higher per-capita density of music-related economic activity. ### Film and Television Production Growth Tennessee's motion picture and video production sector generated $728 million in economic impact during 2024, representing a 45% increase over five years. Nashville benefits from workforce development and production community strength rather than solely tax incentive attraction. **Table 2: Film Production Infrastructure Comparison** | Element | Nashville | Austin | | --------------------------- | ------------------------------------------------ | --------------------------------- | | Annual Film Economic Impact | $728M (statewide) | Variable | | Production Infrastructure | Established workforce, 55th Annual Film Festival | Strong indie scene, SXSW platform | | Tax Incentive Dependency | Low (workforce-driven) | Higher (incentive-sensitive) | | Notable Productions | Holland (2023), Nashville (1974 legacy) | Various tech-focused content | ### Cultural Economy Spatial Distribution From a geographic information systems perspective, Nashville's music infrastructure exhibits clustered spatial organization around downtown core, Gulch, and Music Row districts, creating agglomeration economies. This contrasts with Austin's more dispersed creative economy across multiple districts. --- ## 3. Technology Sector and AI Development ### Tech Ecosystem Transformation Nashville's tech workforce has grown 36.1% since 2015, making it the fastest-growing tech market nationally, with the sector contributing $7.5 billion to local economy. Major corporate investments include Oracle's $1.4 billion Nashville campus for global headquarters and Amazon's 1+ million square feet of office space plus $230 million East Coast operations hub. **Major Tech Company Presence:** **Table 3: Major Tech Investments Comparison** | Company | Nashville Investment | Austin Investment | | ------------- | ------------------------------------- | --------------------------------- | | Oracle | $1.4B global headquarters campus | Significant presence | | Amazon | 1M+ sq ft downtown + $230M ops center | Major fulfillment/tech operations | | Apple | Regional presence | $1B campus | | Tesla | Limited | Gigafactory Texas | | Meta/Facebook | Growing presence | Regional operations | ### AI and Innovation Metrics Oracle's investment is creating 8,500 jobs while Amazon adds 5,000 positions, with tech job growth projected at 12% through 2025 and median salaries reaching $72,645-$84,000 (70-79% above local non-tech jobs). Nashville's AI development focuses on healthcare technology integration, leveraging the concentration of healthcare companies. Genus AI, a generative AI platform for e-commerce brands, generated 10 million product images in 2023 and raised $6 million in funding. ### Spatial Technology Clusters Geographic analysis reveals Nashville's tech development concentrated in: - **Downtown Core**: Oracle, Amazon offices - **The Gulch**: Mixed-use tech/healthcare convergence - **Vanderbilt Corridor**: University-industry research integration - **Suburban Campuses**: Large-scale operations centers --- ## 4. Healthcare Industry Dominance ### Healthcare Economic Scale and Impact Nashville represents the epicenter of American healthcare business, with over 900 healthcare companies including 17 publicly traded headquarters employing nearly 500,000 people across the U.S. and generating more than $97 billion in global annual revenue. **Table 4: Healthcare Industry Leadership** | Metric | Nashville | National Context | | -------------------- | --------- | --------------------- | | Healthcare Companies | 900+ | Highest concentration | | Publicly Traded HQ | 17 | Leading metro | | Global Employment | 500,000+ | Headquartered firms | | Global Revenue | $97B+ | Annual generation | | Local Employment | 126,000+ | Healthcare workers | ### Major Healthcare Entities **HCA Healthcare:** Employs over 18,000 people in Nashville alone, operating as nerve center for 186 hospitals and 2,000 care sites across 21 states and UK. **Vanderbilt University Medical Center:** One of nation's top academic medical centers, anchoring ecosystem of innovation and research alongside vibrant startup environment. ### Healthcare vs. Austin Comparison Austin lacks comparable healthcare industry concentration, instead focusing on tech-enabled health solutions and life sciences research. Austin's life sciences field driven by Dell Medical School and MD Anderson investments represents emerging sector rather than established dominance. ### Geographic Healthcare Distribution Nashville's healthcare geography exhibits strong clustering effects: - **Medical Center Corridor**: Vanderbilt complex - **Downtown Core**: HCA Healthcare headquarters - **Suburban Networks**: TriStar facilities distribution - **Research Triangle**: University-industry partnerships --- ## 5. Universities and Generational Demographics ### Higher Education Landscape With over 120,000 students enrolled across more than 20 colleges and universities, Nashville maintains significant higher education presence supporting company attraction and skilled talent development. **Table 5: Major Universities Profile** | Institution | Enrollment | Focus Areas | Economic Impact | | -------------------------- | ------------------------------- | ------------------------------- | ------------------------ | | Vanderbilt University | 7,152 undergraduate (Fall 2023) | Research, Medicine, Engineering | High research funding | | Belmont University | 7,330 undergraduate (Fall 2023) | Music Business, Healthcare | Industry partnerships | | Tennessee State University | ~8,000 | HBCU, Diverse programs | Community engagement | | Lipscomb University | ~4,000 | Business, Health Sciences | Professional development | ### Generational Workforce Characteristics **Gen Y (Millennials) and Gen Z Economic Impact:** 67.2% of college students nationally are projected to be aged 24 and under in 2024, with 39% of American 18-24 year-olds enrolled in college or graduate school. Nashville's university concentration creates sustained pipeline of young professionals. **Demographics and Migration Patterns:** During the 2000s, Nashville experienced substantial demographic shift with notable increase in younger professionals moving for tech and healthcare opportunities, supported by construction boom increasing housing availability. ### University Economic Contributions **Research and Development Impact:** - Between 2005-2015, over $940M was invested in Nashville healthcare companies by venture capital firms, representing 60% of total venture capital investment - University-industry partnerships drive innovation in healthcare technology - Student retention contributes to workforce stability ### Austin University Comparison Austin benefits from University of Texas flagship campus with larger enrollment and research budget, but Nashville's multiple institutions create more diverse educational ecosystem. UT Austin's leadership in technology and AI development competes directly with Nashville's healthcare-tech convergence. --- ## 6. Nashville vs. Austin: Comprehensive Metropolitan Analysis ### Economic Diversification Strategies **Nashville's Approach:** - Healthcare industry anchoring providing recession-resistant foundation - Music industry cultural capital maintaining tourism and media attraction - Tech sector growth leveraging healthcare industry synergies - Geographic centrality supporting logistics and distribution **Austin's Approach:** - Tech sector dominance with 65% growth between 2018-2023, anchored by Apple, Tesla, Google alongside Dell and Whole Foods - Government employment providing stability through state capital functions - Music industry (SXSW, ACL) serving as cultural differentiator - Energy sector connections through Texas oil economy ### Population Growth Sustainability **Nashville Advantages:** - Consistent 1.37% annual growth with continued attraction of skilled workers - Lower cost of living relative to tech hubs - Healthcare industry recession-resistance - Central location accessibility **Austin Challenges:** - Growth slowed to 0.4% between 2023-2024, slowest among nation's 15 largest cities, tied to affordability challenges and post-pandemic tech downturn - Housing affordability crisis limiting retention - Tech sector volatility creating economic uncertainty ### Affordability and Quality of Life **Table 6: Cost of Living and Quality Metrics** | Factor | Nashville | Austin | Advantage | | --------------------------- | --------- | --------- | --------- | | Median Home Price | $490,000 | $350,600 | Austin | | Average Household Income | $112,434 | $130,163 | Austin | | Cost-Adjusted Income | Moderate | Lower | Nashville | | Population Growth Stability | High | Declining | Nashville | | Industry Diversification | High | Moderate | Nashville | ### Labor Market Dynamics **Nashville Strengths:** - 47,000 more job openings than unemployed individuals, creating job seeker's market - Industry diversity reducing cyclical unemployment - Healthcare industry providing stable employment base **Austin Concerns:** - Average rental rate around $1,394 with wage growth of 4.5% not keeping pace with housing costs, driving lower-wage earners to relocate - Tech sector concentration creating vulnerability to industry cycles --- ## 7. Demographic and Generational Analysis ### Age Distribution and Migration Patterns **Gen Y and Gen Z Characteristics in Nashville:** Gen Z values experiences over possessions, with 34% planning increased travel in 2025 and international travel plans rising 17% since 2020. Nashville's music and cultural amenities align with these preferences. **Migration Dynamics:** - **Inbound Migration**: Young professionals from higher-cost metros (California, New York, Illinois) - **Educational Pipeline**: University retention contributing to skilled workforce - **Cultural Attraction**: Music and entertainment industry drawing creative professionals ### Workforce Development and Skills **Educational Infrastructure Impact:** - Professional, scientific & technical services industry seeing 6.4% employment increase, containing high-wage technical occupations in legal, accounting, advertising, and scientific research - University-industry partnerships providing skilled pipeline - Healthcare education creating specialized workforce ### Spatial Demographics and GIS Considerations **Urban Core Demographics:** - Young professional concentration in downtown/Gulch areas - University-adjacent neighborhoods maintaining student populations - Suburban growth patterns accommodating families **Economic Geography Implications:** - Transit infrastructure supporting workforce mobility - Major industries including Health Care Management, Technology Manufacturing, and Higher Education creating spatial employment clusters --- ## 8. Strategic Implications and Future Projections ### Industry Convergence Opportunities **Healthcare-Technology Integration:** Nashville's unique positioning allows healthcare companies to leverage AI and technology innovations, creating synergistic growth opportunities unavailable in purely tech-focused metros like Austin. **Music-Technology Convergence:** Digital media and music technology creating new economic opportunities combining Nashville's cultural assets with technological capabilities. ### Demographic Sustainability **Population Projections:** Metro Nashville population projected to reach 1,422,000 by 2030 and 1,483,000 by 2035, representing continued 150,000 person increase over next decade. **Educational Pipeline:** Sustained university enrollment supporting workforce development, though national demographic cliff predicting 15%+ decline in college students after 2025 may impact long-term growth. ### Competitive Positioning vs. Austin **Nashville Advantages:** 1. **Industry Diversification**: Healthcare anchoring reducing economic volatility 2. **Geographic Centrality**: Superior logistics and connectivity 3. **Cost-Effectiveness**: Better cost-adjusted income ratios 4. **Growth Sustainability**: Continued population growth vs. Austin's deceleration **Austin Advantages:** 1. **Higher Incomes**: Superior absolute income levels 2. **Tech Leadership**: Deeper technology ecosystem 3. **State Support**: Texas state policies supporting business 4. **Scale**: Larger metropolitan economy ### Policy and Planning Implications **Infrastructure Development:** - Transportation network supporting 523 daily flights and highway connectivity requiring continued investment - Housing affordability maintaining competitive advantage over Austin - Transit system development supporting workforce mobility **Economic Development Strategy:** - Continued healthcare industry expansion - Technology sector recruitment leveraging healthcare synergies - Cultural economy preservation maintaining unique identity --- ## 9. Conclusions and Strategic Recommendations ### Nashville's Competitive Position Nashville has successfully transformed from a regional music center into a diversified economic powerhouse, demonstrating superior growth sustainability compared to Austin through strategic industry development and demographic advantages. The combination of 2% employment growth, 2.9% unemployment, and projected state GDP growth of 2.5% in 2025 versus national 2% indicates sustained competitive advantage. ### Key Success Factors 1. **Industry Diversification**: Healthcare industry providing recession-resistant foundation while tech and music sectors drive innovation 2. **Geographic Advantages**: Central location supporting logistics, tourism, and business connectivity 3. **Educational Infrastructure**: University system creating sustained talent pipeline 4. **Cultural Assets**: Music industry maintaining unique identity and tourism attraction 5. **Cost Competitiveness**: Superior cost-adjusted income ratios supporting population growth ### Strategic Recommendations **For Economic Development:** - Continue healthcare-technology convergence initiatives - Invest in transportation infrastructure supporting growth - Maintain housing affordability competitive advantage - Develop workforce training programs for emerging technologies **For Urban Planning:** - Support mixed-use development in core districts - Enhance transit connectivity between employment centers - Preserve cultural districts while accommodating growth - Plan infrastructure capacity for projected population increases **For Policy Makers:** - Leverage healthcare industry expertise for national policy influence - Support university-industry partnership development - Maintain competitive business environment - Address housing affordability challenges proactively ### Future Research Directions **Sociological Considerations:** - Gen Z workplace preferences and retention strategies - Cultural economy evolution and authenticity preservation - Social equity implications of rapid economic growth **Economic Analysis:** - Healthcare industry resilience during economic cycles - Technology sector spillover effects on traditional industries - Regional economic integration and supply chain development **Geographic Information Systems Applications:** - Spatial analysis of industry clustering effects - Transportation network optimization for economic growth - Environmental impact assessment of population growth patterns Nashville's transformation represents a successful model of economic diversification and demographic sustainability, positioning the metropolitan area for continued growth and competitiveness in the evolving American economy. The city's ability to maintain cultural identity while embracing economic transformation provides valuable insights for other medium-sized metropolitan areas seeking sustainable development strategies. --- ## Data Sources and Methodology This analysis incorporates data from Nashville Area Chamber of Commerce, Tennessee Department of Labor, U.S. Bureau of Labor Statistics, Nashville Health Care Council, Texas Workforce Commission, and various industry reports through Q4 2024 and projections for 2025. Economic comparisons utilize standardized metropolitan statistical area definitions and inflation-adjusted metrics where applicable. Demographic analysis incorporates Census Bureau estimates and university enrollment data. Industry-specific data sourced from trade associations and corporate reports.